Back to Graphical view overview
Tree view  click "new" in the Graphical View tab.
(This tab may be closed. Click to open it if so)
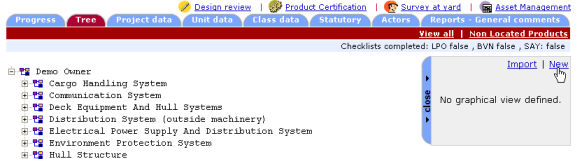
A pop-up will open, giving you the opportunity to choose between the graphical view types available for your project.
In this tutorial, we will choose "Free graphical view", which is always available.
Other kinds of graphical views should only be chosen in order to generate systems or products on tree.
For more information about object generation, see System / Product generation.
For an explanation about Graphical View usage, please read Graphical view : overview.
The creation of a graphical view from scratch usually follows these steps :
Find the image you will use as a background to draw over, and prepare it ;
Create a view using the image as a background ;
Draw over the image to represent what is needed to point out
Group and name shapes ;
Optionally use the "auto-draw joint" tool ;
Name your drawing, optionally choose some kind of information to display, and save it ;
Link the objects you drew to tree systems/products.
Your graphical view is ready to use, and will be shared between all users of your activity.
In order to create a graphical view from scratch, you will usually need a plan that will help you to draw on. For instance :
General arrangement to draw compartments and tanker ;
Block plan ;
Inspection plan...
The drawing editor supports JPG, GIF, PNG formats for raster images, and SVG format for vectorial images :
You may obtain a JPG, GIF or PNG image by scanning a plan. Be careful about the size (width and height), which, to avoid memory problems, shouldn't exceed 8000 x 5500 pixels. Resize your image with your favourite editor if bigger.
SVG is a vector based format. Therefore it prevent from quality loss when zooming in. SVG images can be obtained from a DWG/DXF drawing using Autocad "export" function.
For our example, we will draw compartments on a simple raster image : sample-tanker.jpg
Once on the editing screen (follow Steps above), you may notice that drawing is impossible, since you haven't created a view. Views represent areas where you draw. Usually, a view corresponds to a background image, but you may also create a view without background.
|
|
Create a view, by clicking the "add view" tool. You will then be prompted for a background image :
|
You should obtain something similar to this :
|
|
When adding a view, Editor automatically switches to "Organize views" mode. You can also access this mode whenever you want by clicking it's icon.
|
In "organize views" mode, views are represented by gray rectangles that you can move and resize freely.
To move a view, drag and drop the rectangle with your mouse.
To resize a view, select it by clicking it. Resize boxes will appear at corner of the rectangle. Drag and drop these boxes with your mouse to resize object.
To add or remove background image of a view, double click it.
To delete a view, select it and press "Del" key. You will be asked for confirmation.
In our case, we have only one view, so we will resize and move it to fill all the available space :
|
|
In our example, we want to represent compartments. Note that this applies as well to blocks, zones or whatever. Most of our compartments are rectangular, so we'll use the "rectangle tool" which is the quickest tool to create areas. Select it in the toolbar. (Notice that the view is not gray anymore, as we're not in "organize views" mode anymore) |
|
|
To draw a rectangle :
If you wish to draw small areas, you can zoom and pan to make it easier. |
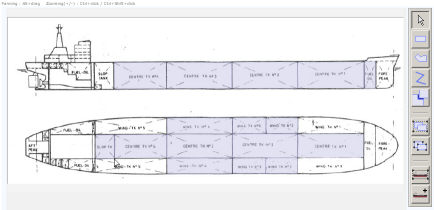
Draw all the rectangle compartments :
|
|
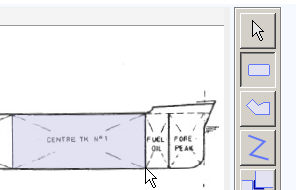
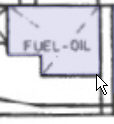
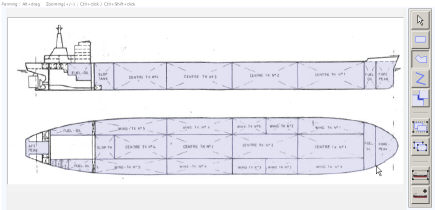
Some of our compartments are not rectangular. We will use the "free area" tool to represent them. Select the free area tool. |
To draw a free area :
|
|
|
|
|
|
Click once to indicate first point.
|
Click once to indicate second point |
Keep going for each point |
Double-click to indicate the last point and finish drawing |
Notes :
If you indicated a wrong point, you may press the "Esc" key, which will cancel the polygon creation.
The editor helps you to draw straight lines by making horizontal the lines "nearly horizontal". To deactivate this help, press "Shift" key when drawing
zoom and pan to draw small areas more easily.
Draw all the necessary area by repeating the previous operations.
|
|
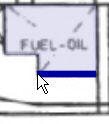
On some drawing, you may want to represent thin objects, like block joints or separating walls. Select the "polyline" tool. |
Draw polylines exactly the same way you would draw polygons:
|
|
|
|
|
Click once for first point |
Click once for each next point |
Double-click for last point |
|
|
As the "organize views" tool lets you resize, move end delete views, the "select" tool lets you reshape, edit name, or delete any object you draw. Switch to "select" tool. |
To delete an object, simply select it by clicking it, and press "Del" key.
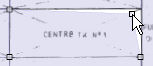
To reshape an object, select it, then drag and drop it's "shape" boxes. Notice that shapes drawn with rectangle tool can be reshaped freely.
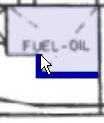
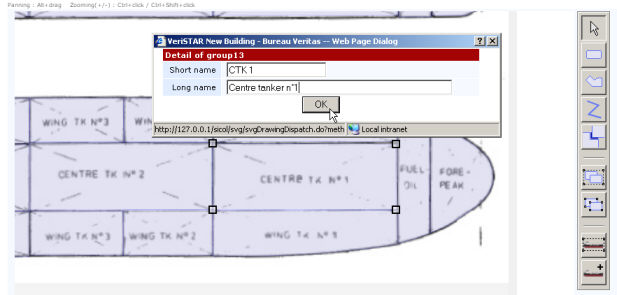
To name an object, double click it. A dialog box will ask you for short and long name. These names will be displayed in view mode, when mouse cursor will be over the item.
Note : Items should be grouped before giving a name.
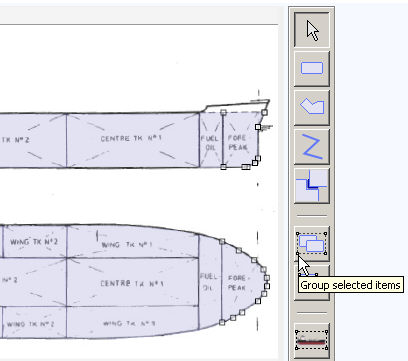
The grouping item tool should be used when two or more drawn objects (rectangles, polygons, polylines), represent only one entity.
|
|
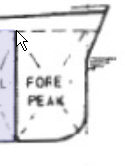
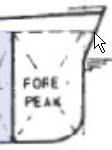
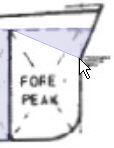
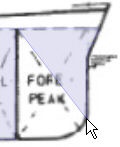
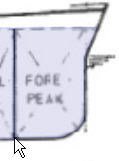
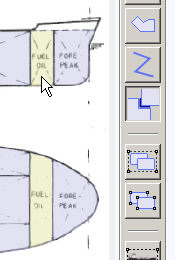
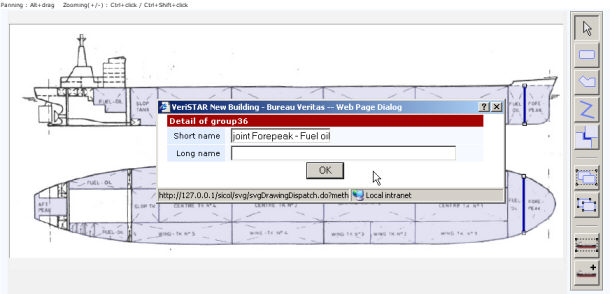
For instance, on our drawing, the fore-peak appears once on each view. Therefore the two polygons should be grouped.
To group shapes :
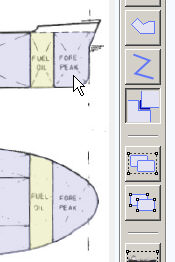
You will be automatically asked for a short and long name.
Notice that after grouping, clicking one shape will select all the shapes of the group. |
|
|
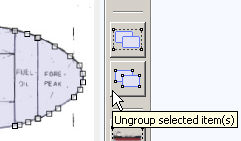
If you made grouping mistake, you may ungroup shapes :
|
|
|
The "Auto-draw joint" tool helps you drawing joints between polygons. It create polylines in a group, similar to the ones you can manually draw. Therefore you can ungroup, regroup and rename joints in the same way as normal polylines. This tool is mainly interesting for blocks plans, if you want to represent each joint between blocks. Important : You should have grouped and named your objects before using this tool (see step 4) Select the "Auto-draw joint" tool. |
|
|
|
|
|
Click on the first item or group. The item/group is highlighted. |
Then click on the second item/group. |
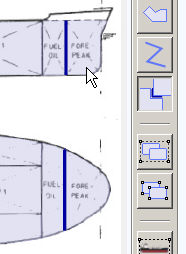
A polyline representing the joint is created. You may click another pair of items/groups to find another joint. |
As you may notice, the tool tries to find joints between all shapes of groups, so that joints appear in all views.
The created polylines are member of a unique group, which name is "Interface item1 - item2". Therefore items must be named before being grouped (you can name items directly in "auto-draw joint" mode by double-clicking an item).
Note : The "Auto-draw joint" tool is usually able to find complex joints with angles, even if segments are a bit spaced, or not parallel. However, if the polygons are too spaced or segments not parallel enough, you may be asked you to draw the joint by hand with polyline tool.
|
|
|
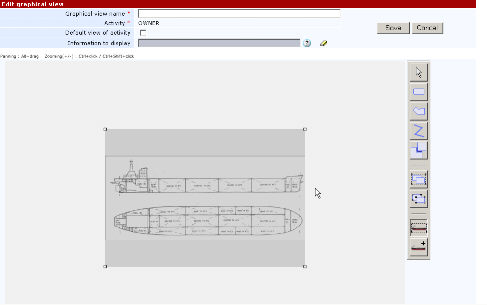
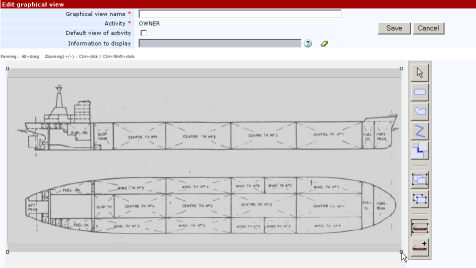
The top part of the editor allows you to enter data for your graphical view.
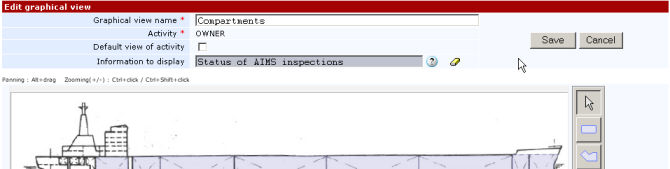
Give an explicit name to your graphical view
Choose an activity.
If the view is created from an AIMS / BVN / LPO/ SAY tree, then this activity is fixed.
Note that the drawing will be seen only on the tree of this activity, shared by all users.
Check the default box if you want this view to be the first one you see when connecting.
Optionally choose an "information to display". The available informations to display depend on the activity you chose. In our example, we will display the status of AIMS inspections.
Finally click the Save button.
This will bring you back to tree view, with your graphical view on right part.
Now that an information to display is chosen (state of AIMS surveys), a legend is available. Open it by clicking the "Show/hide legend' link.
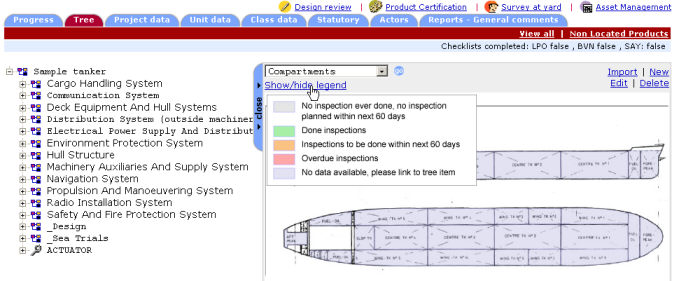
For now, all the compartments are blue, since they are not linked to tree items.
Final step will be to Link graphical objects to tree items.
 button, click browse and choose your background image (sample-tanker.jpg);